Phase 1: Baseline Diagnostic Results
Before tuning anything, the baseline model's outputs were analyzed to understand what the model was learning and where it was struggling.
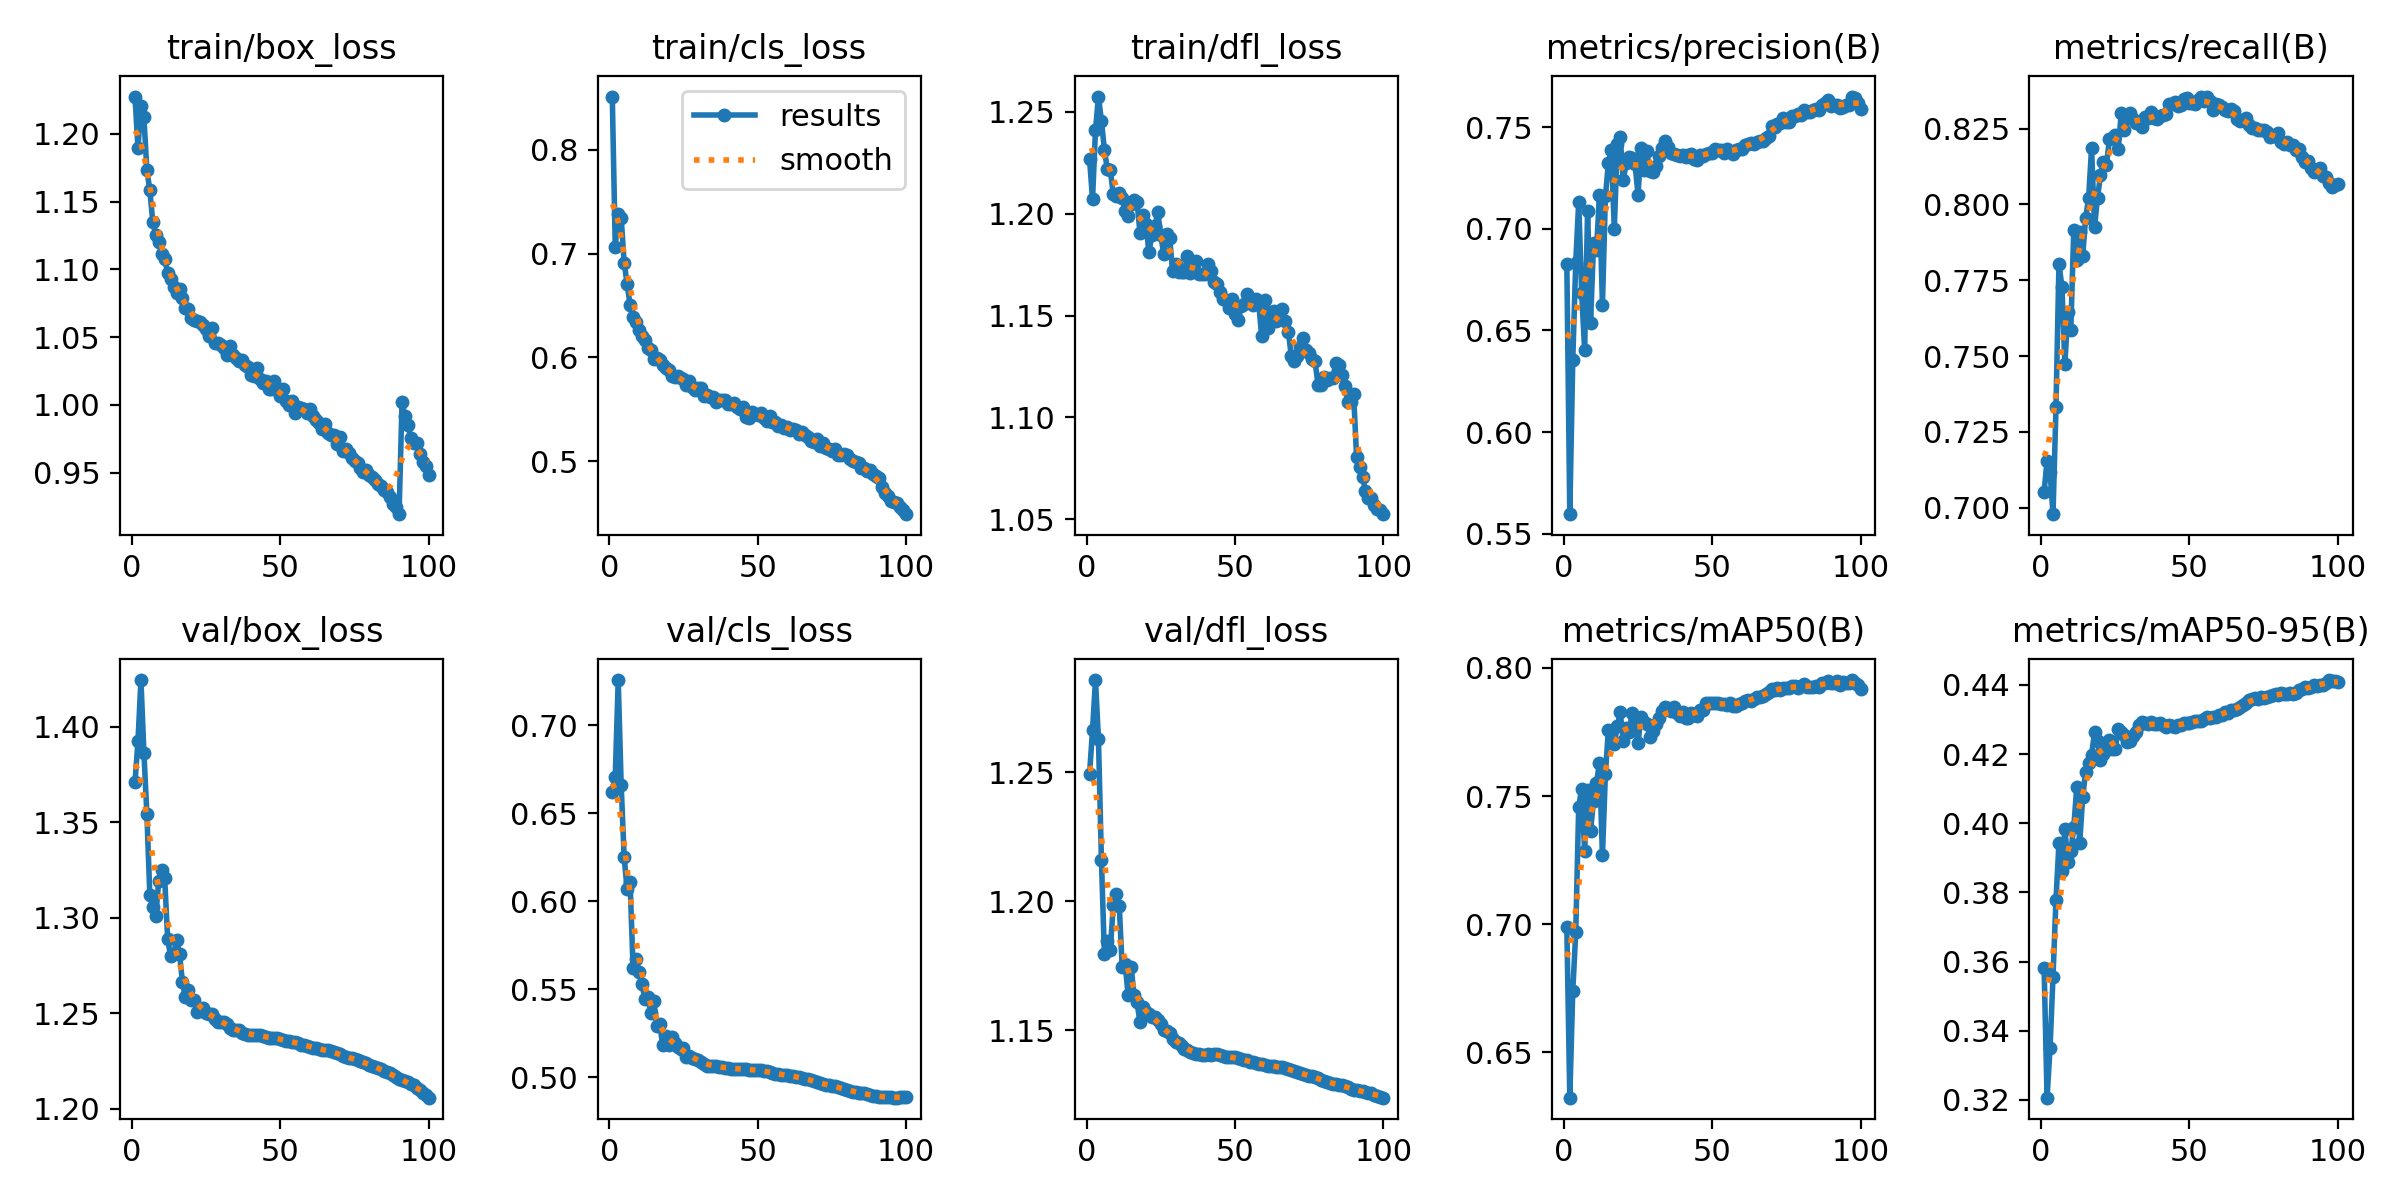
Figure 1: Training and Validation Loss Curves (Box, Cls, DFL).
Training Convergence
The Results.png plot shows healthy convergence. Both training and validation losses — Box, Class, and DFL — decrease steadily, confirming the model is learning without immediate overfitting.
- Box Loss: How accurately the model pinpoints the mite's location.
- Cls Loss: Accuracy of the Bee vs. Varroa classification.
- DFL Loss: Refines bounding box edges for small, hard-to-distinguish objects.
The "Hallucination" Factor
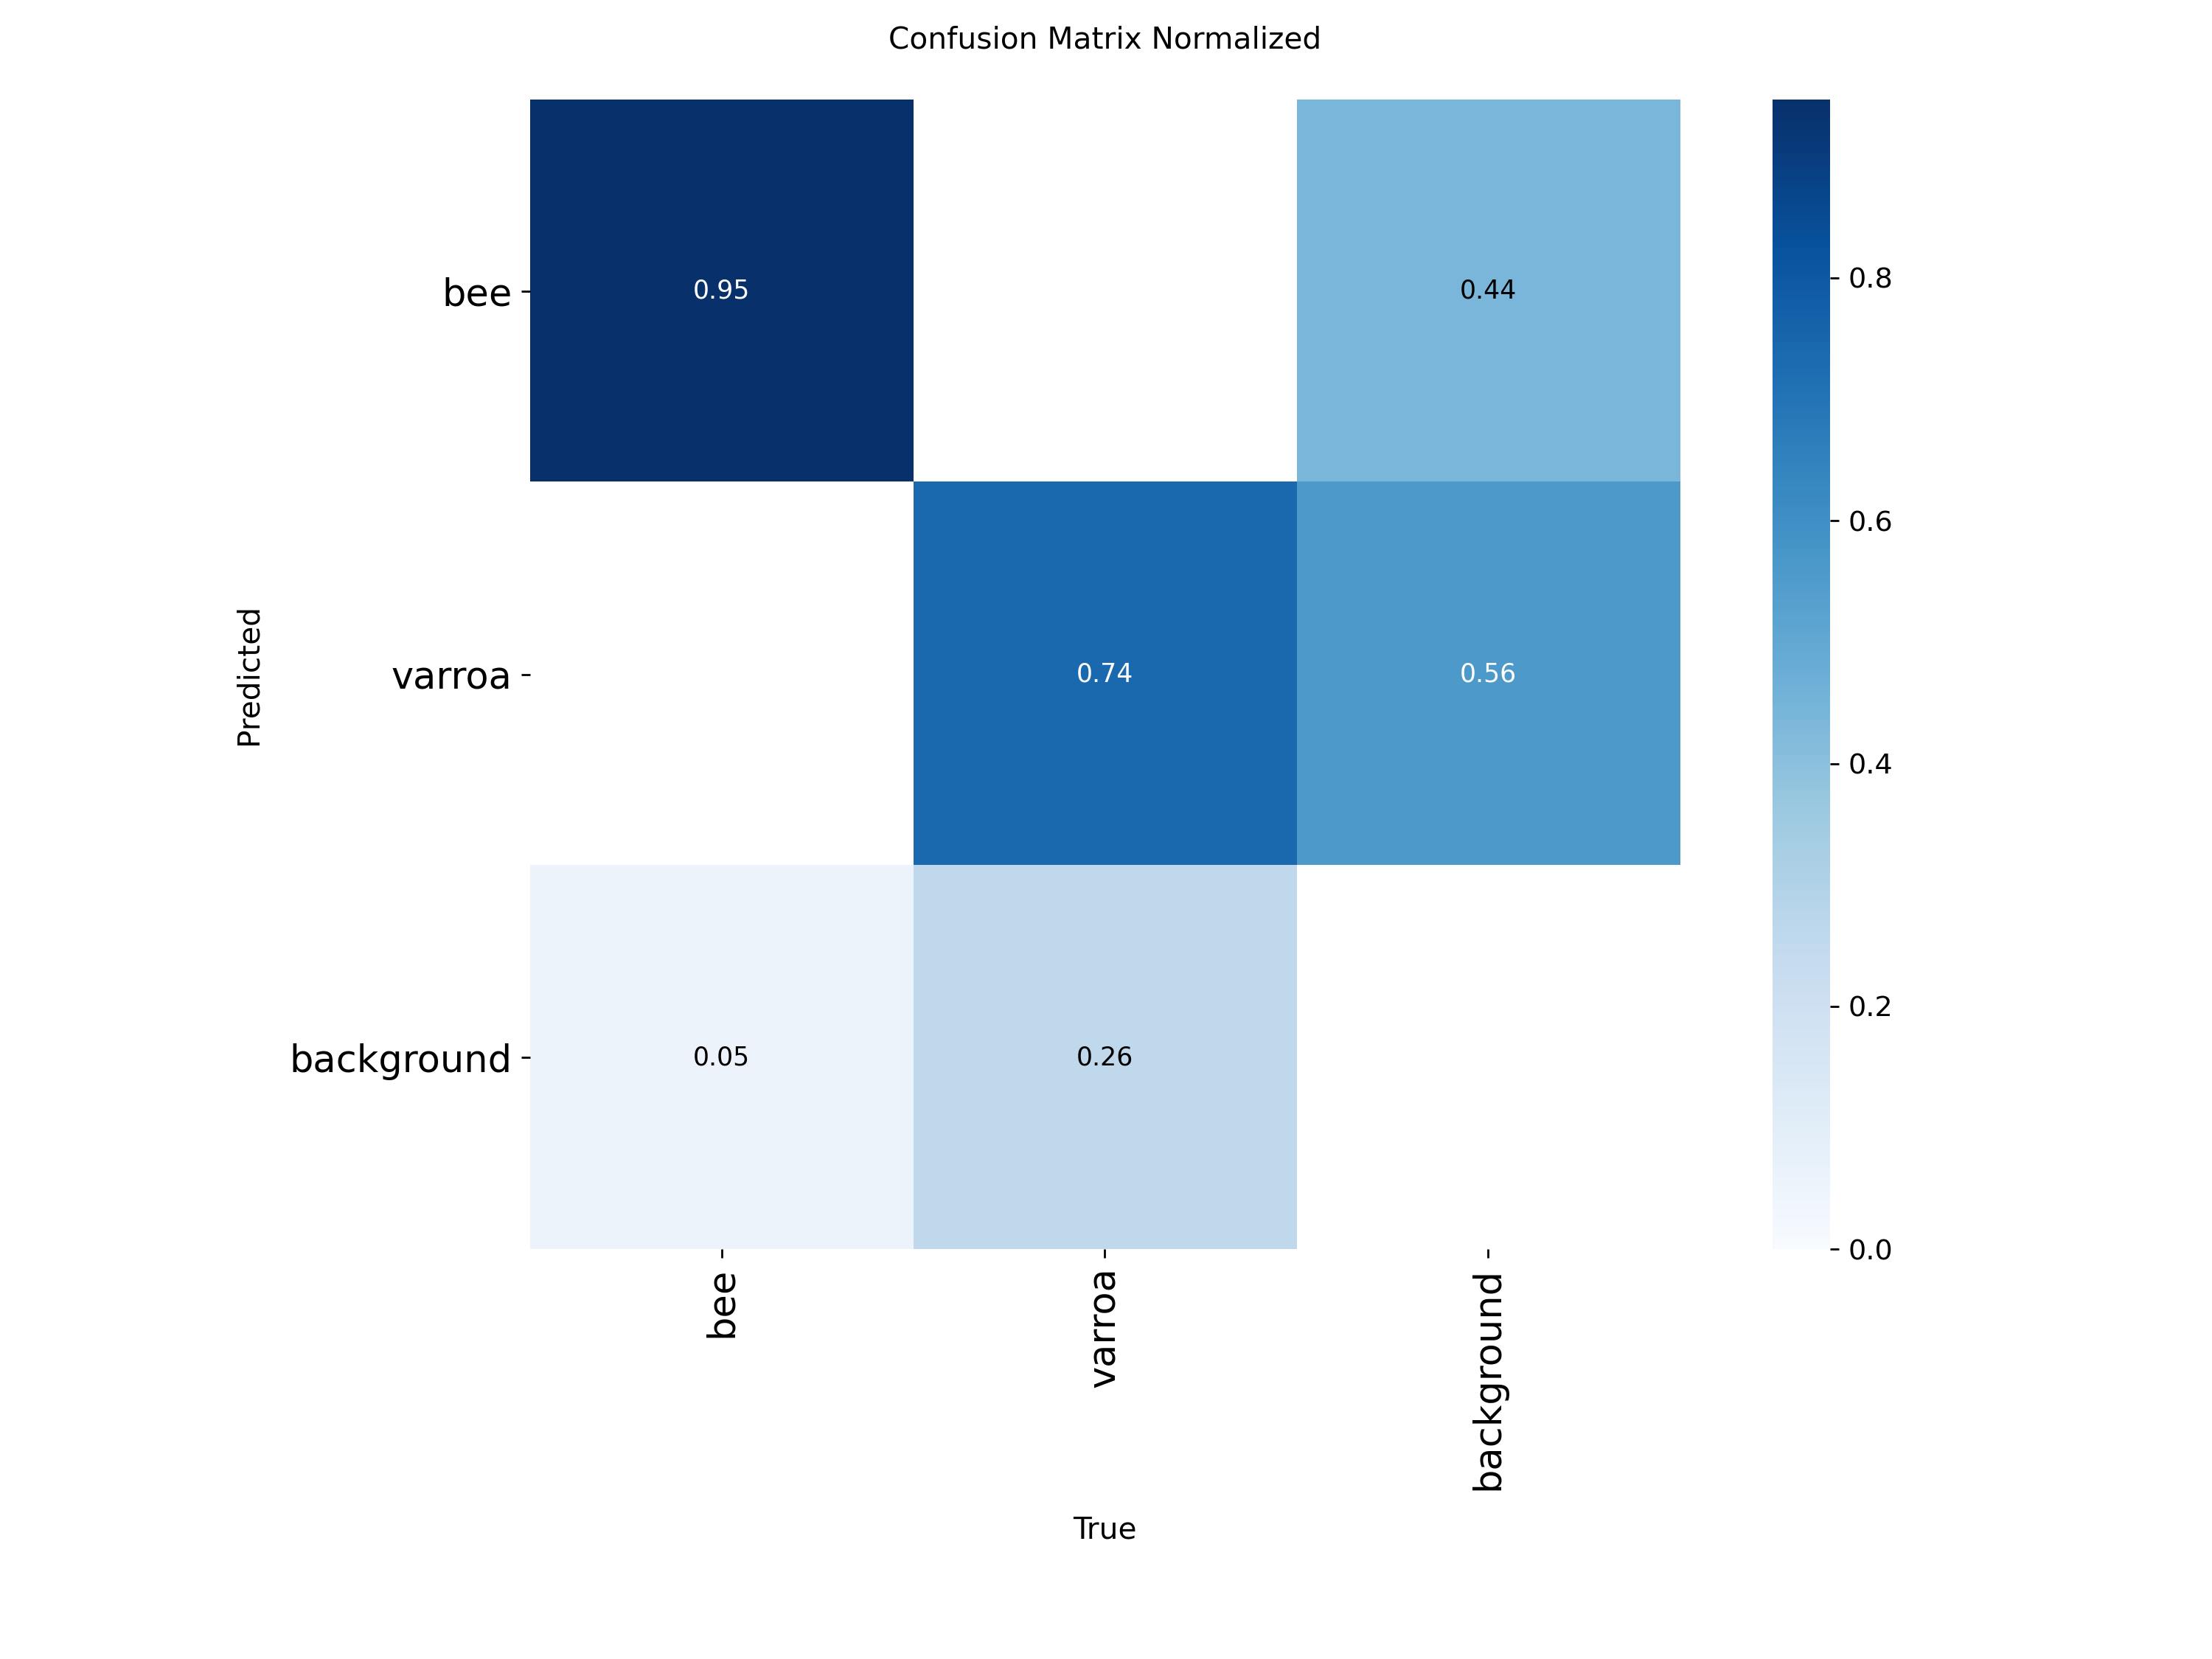
The Confusion Matrix highlights our primary challenge: a 56% background-to-varroa error rate. The model frequently mistakes bee anatomy or shadows for mites — this is the core problem the later experiments address.
Precision-Recall Tradeoff
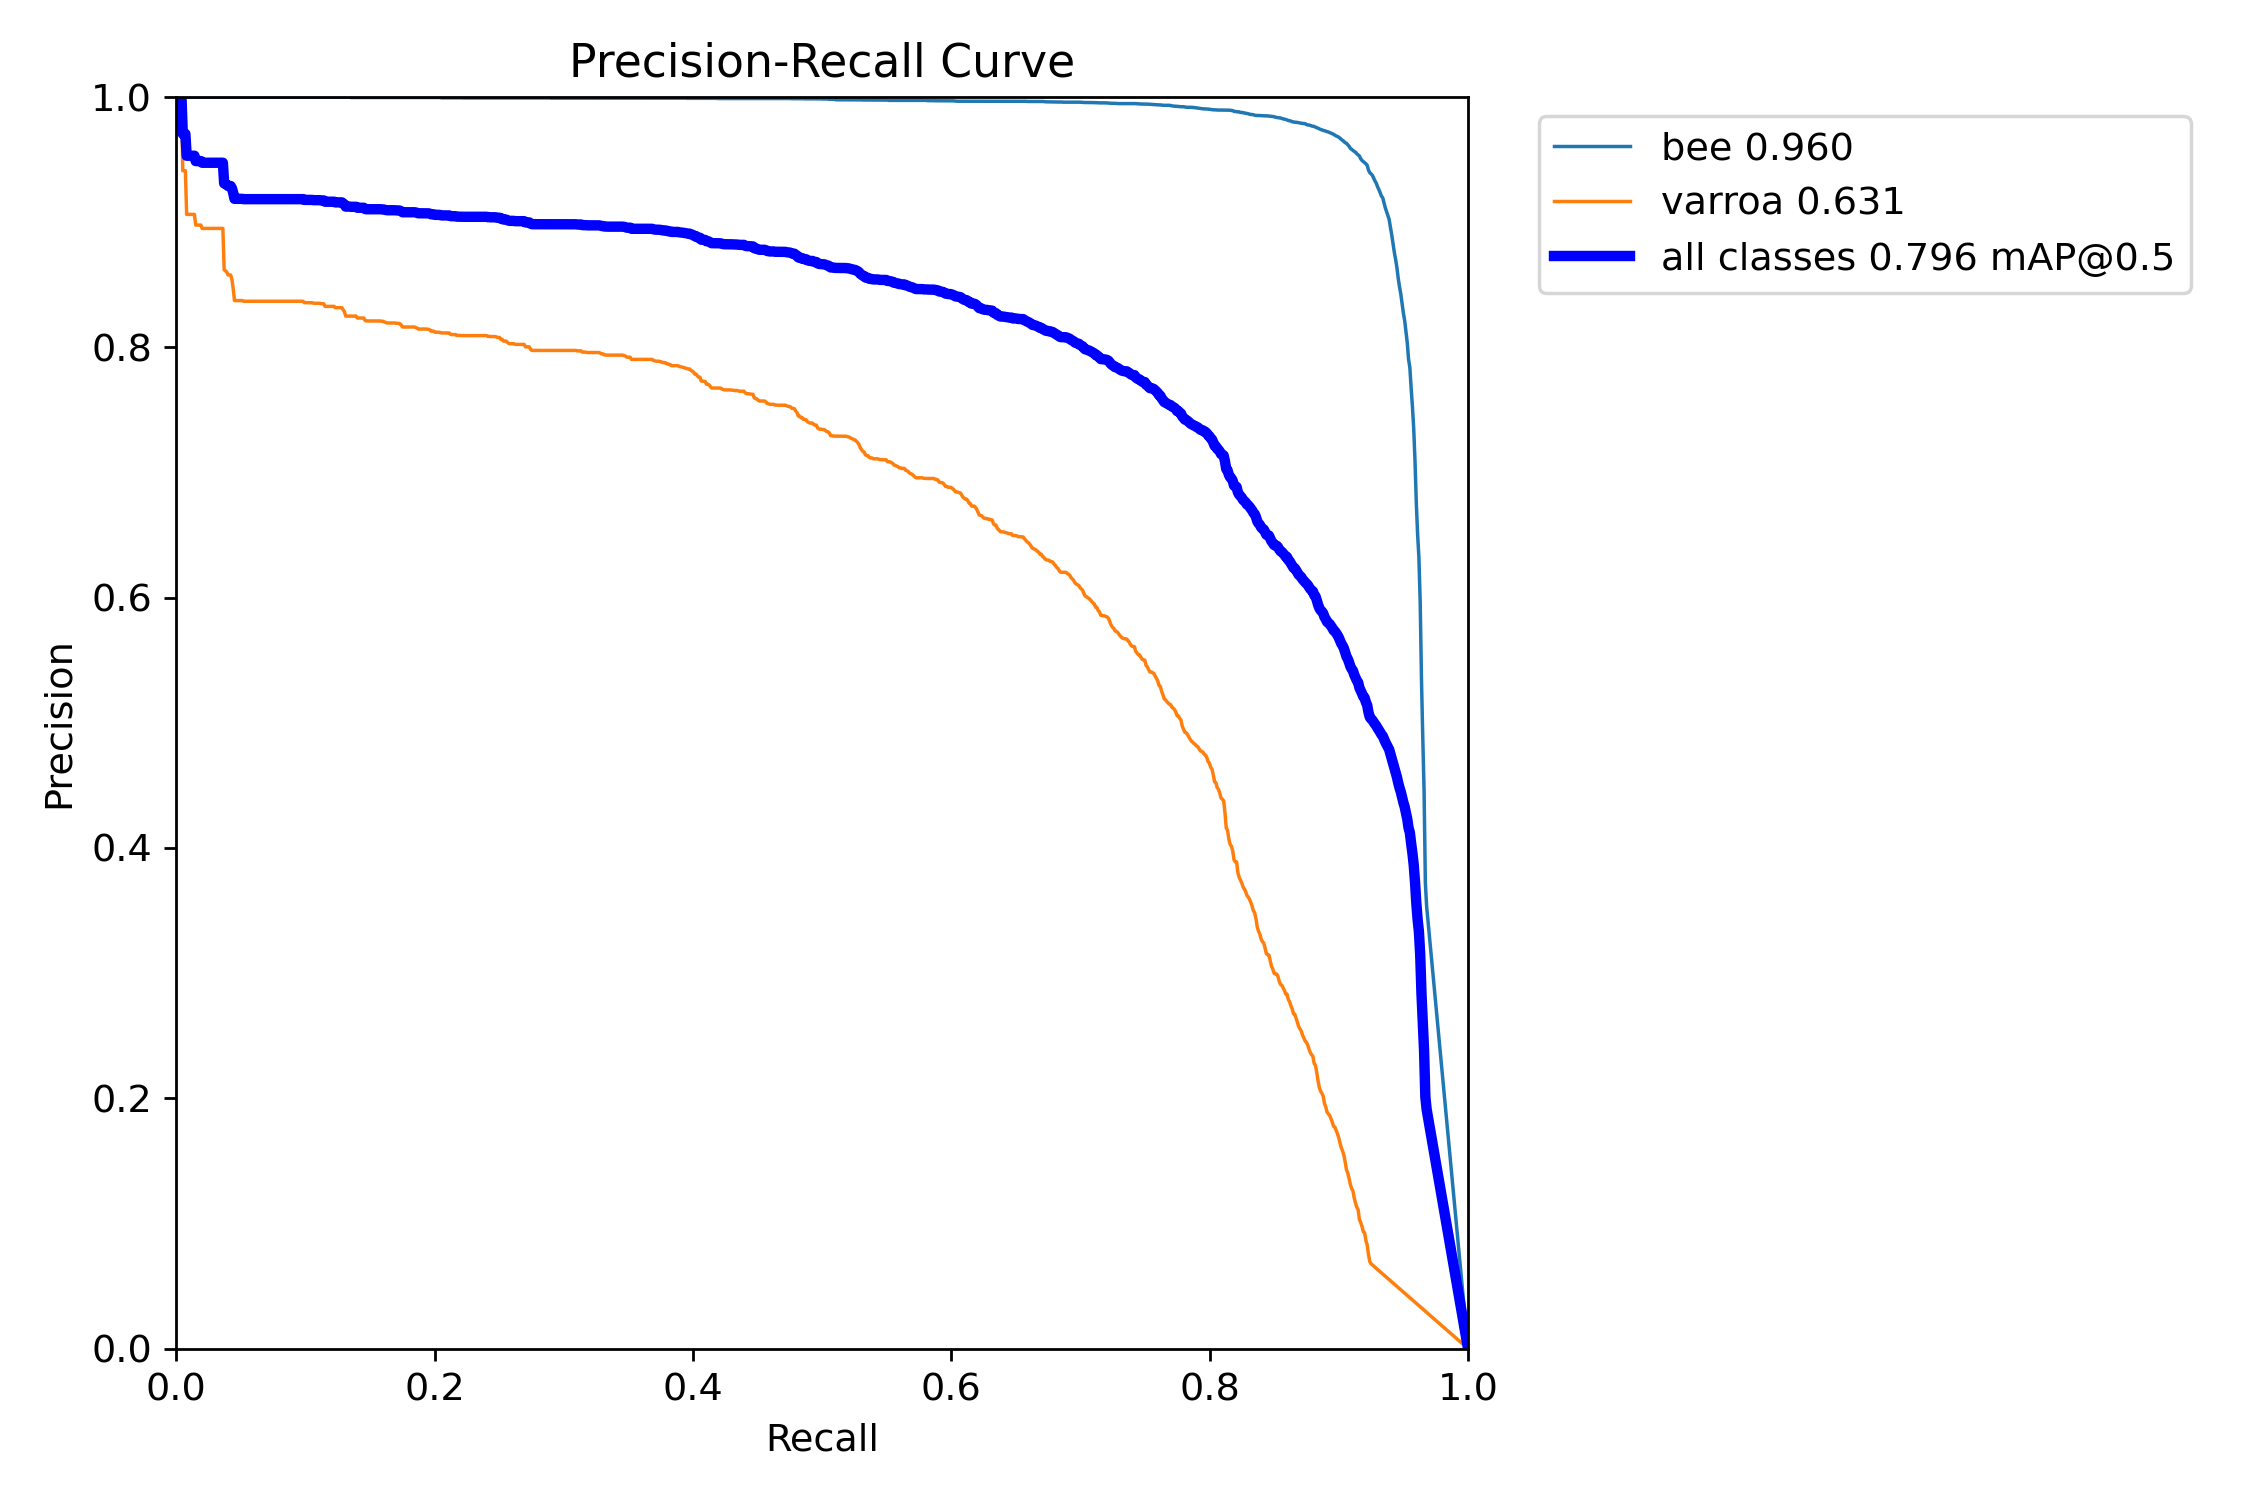
The PR Curve reveals the gap between classes. Bee detection is near-perfect (0.96 mAP), while the Varroa curve (0.63 mAP) drops sharply — the model struggles to maintain accuracy as it tries to find more mites.
Class Imbalance & The P2 Plan
Labels.jpg confirms the ~4:1 bee-to-varroa class imbalance visible in the dataset. In object detection, this can cause the model to favor the "easier" majority class (Bees) while neglecting the "harder" minority class (Varroa).
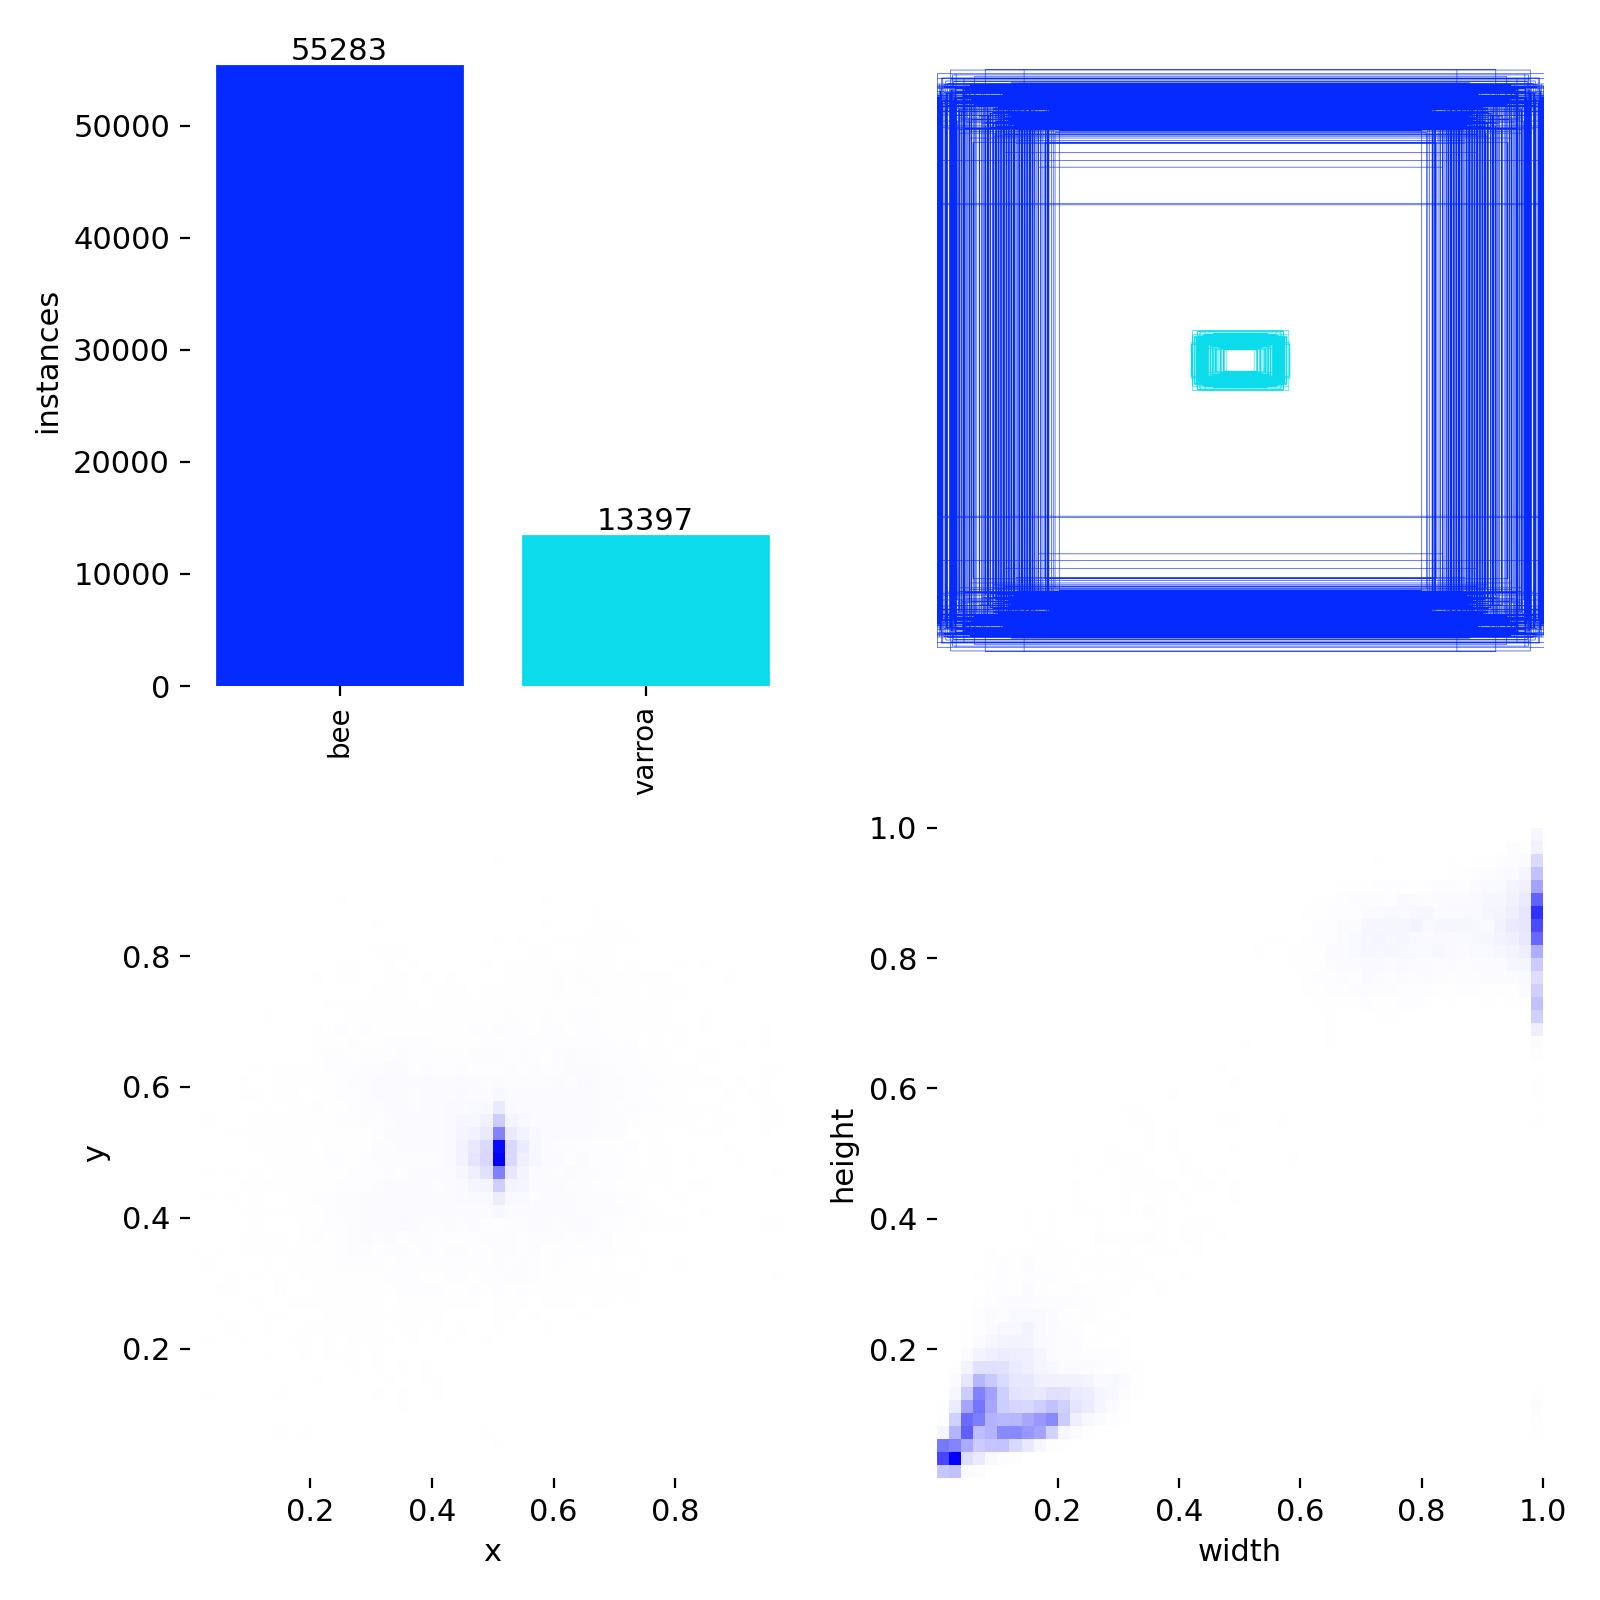
Figure 4: Spatial distribution and instance counts of Bee vs. Varroa labels.
Key Findings Across All Experiments
RT-DETR leads overall
RT-DETR achieves mAP50=0.9635 and mAP50-95=0.6406 — outperforming the best YOLOv8s run by
+0.018 and +0.033 respectively, with recall up +0.027.
The transformer architecture generalises better on classification without needing the cls=0.05 fix.
All runs still converging at epoch 200
Best epochs occur at 196–200 across every experiment. Extended training with early stopping is the clear next step — particularly for RT-DETR, whose mAP50-95 curve shows no sign of plateauing.
cls=0.05 is the strongest single YOLO change
Reducing classification loss weight from 2.0 to 0.05 consistently improved mAP50-95 and eliminated the rising
val cls loss seen in cls=2.0 runs after epoch 50 — a clear sign of overfitting on classification.
Mixup augmentation showed no consistent benefit across either dataset scale.
2 datasets outperform 124 datasets
All 2-dataset runs score ~0.94+ mAP50 vs ~0.86–0.89 for 124-dataset runs. The gap points to quality differences or distribution mismatch in the extended dataset pool — consistent with the findings from the Debug Saga.
Training Curves
All 7 runs plotted over 200 epochs. Hover for per-run values.
Experiment Legend
mAP50 — Validation
mAP50-95 — Validation
Val Classification Loss
Val Box / GIoU Loss
Note on Val Box / GIoU Loss
RT-DETR uses GIoU loss for bounding box regression while YOLOv8s uses CIoU-based box loss. The two losses operate on different scales (~0.28–0.41 vs ~1.02–1.24) and are not directly comparable — treat them as independent convergence indicators per architecture.
Final Epoch Comparison
All runs sorted by mAP50-95 (best first).
RT-DETR vs Best YOLOv8s
Head-to-head: RT-DETR · 2ds versus YOLOv8s cls=0.05 · 2ds (best YOLO configuration).
RT-DETR · 2ds
YOLOv8s cls0.05 · 2ds
Δ (RT-DETR − YOLO)
Next Steps
Recommended next experiments
- Extend training to 300–400 epochs with early stopping — all runs peaked at epoch 200 with no plateau
- Test cls=0.05 on RT-DETR — the transformer already achieves low cls loss by default; confirm whether the fix still applies
- Add P2 detection head (stride 4) — varroa instances are often <10px; the P2 head analyses at higher resolution to recover these
- Investigate 2ds vs 124ds gap — audit 124-dataset sources for labelling quality and distribution mismatch
- Edge deployment evaluation — benchmark RT-DETR and YOLOv8s inference speed on target hive hardware
Scientific References
[1] Bilik, S., et al. (2021). Visual Diagnosis of the Varroa Destructor Parasitic Mite in Honeybees. Sensors.
[2] Ultralytics Documentation. Performance Metrics Deep Dive: Interpreting PR Curves and mAP.
[3] Jocher, G., et al. (2023). YOLOv8: Real-Time Object Detection and Architectural Evolution.